It’s that time of year again. The holidays are winding down and our thoughts turn towards…the Snow Water Equivalent (SWE) of our snowpack. Well…at least they do for us! Here in western Colorado, a snowy winter is the promise of a good water year and that hope that our rivers will run long, the fields will stay green, and our skies will remain free of wildfire smoke. And so, mid January marks the time after the first snows have come, ski resorts have opened, and whatever we might consider as a winter base has been determined in our mountain snowpack. So let’s take a look at where we are at with regards to our snowpack and how to make sense of all the data that exists in determining a snowy winter.
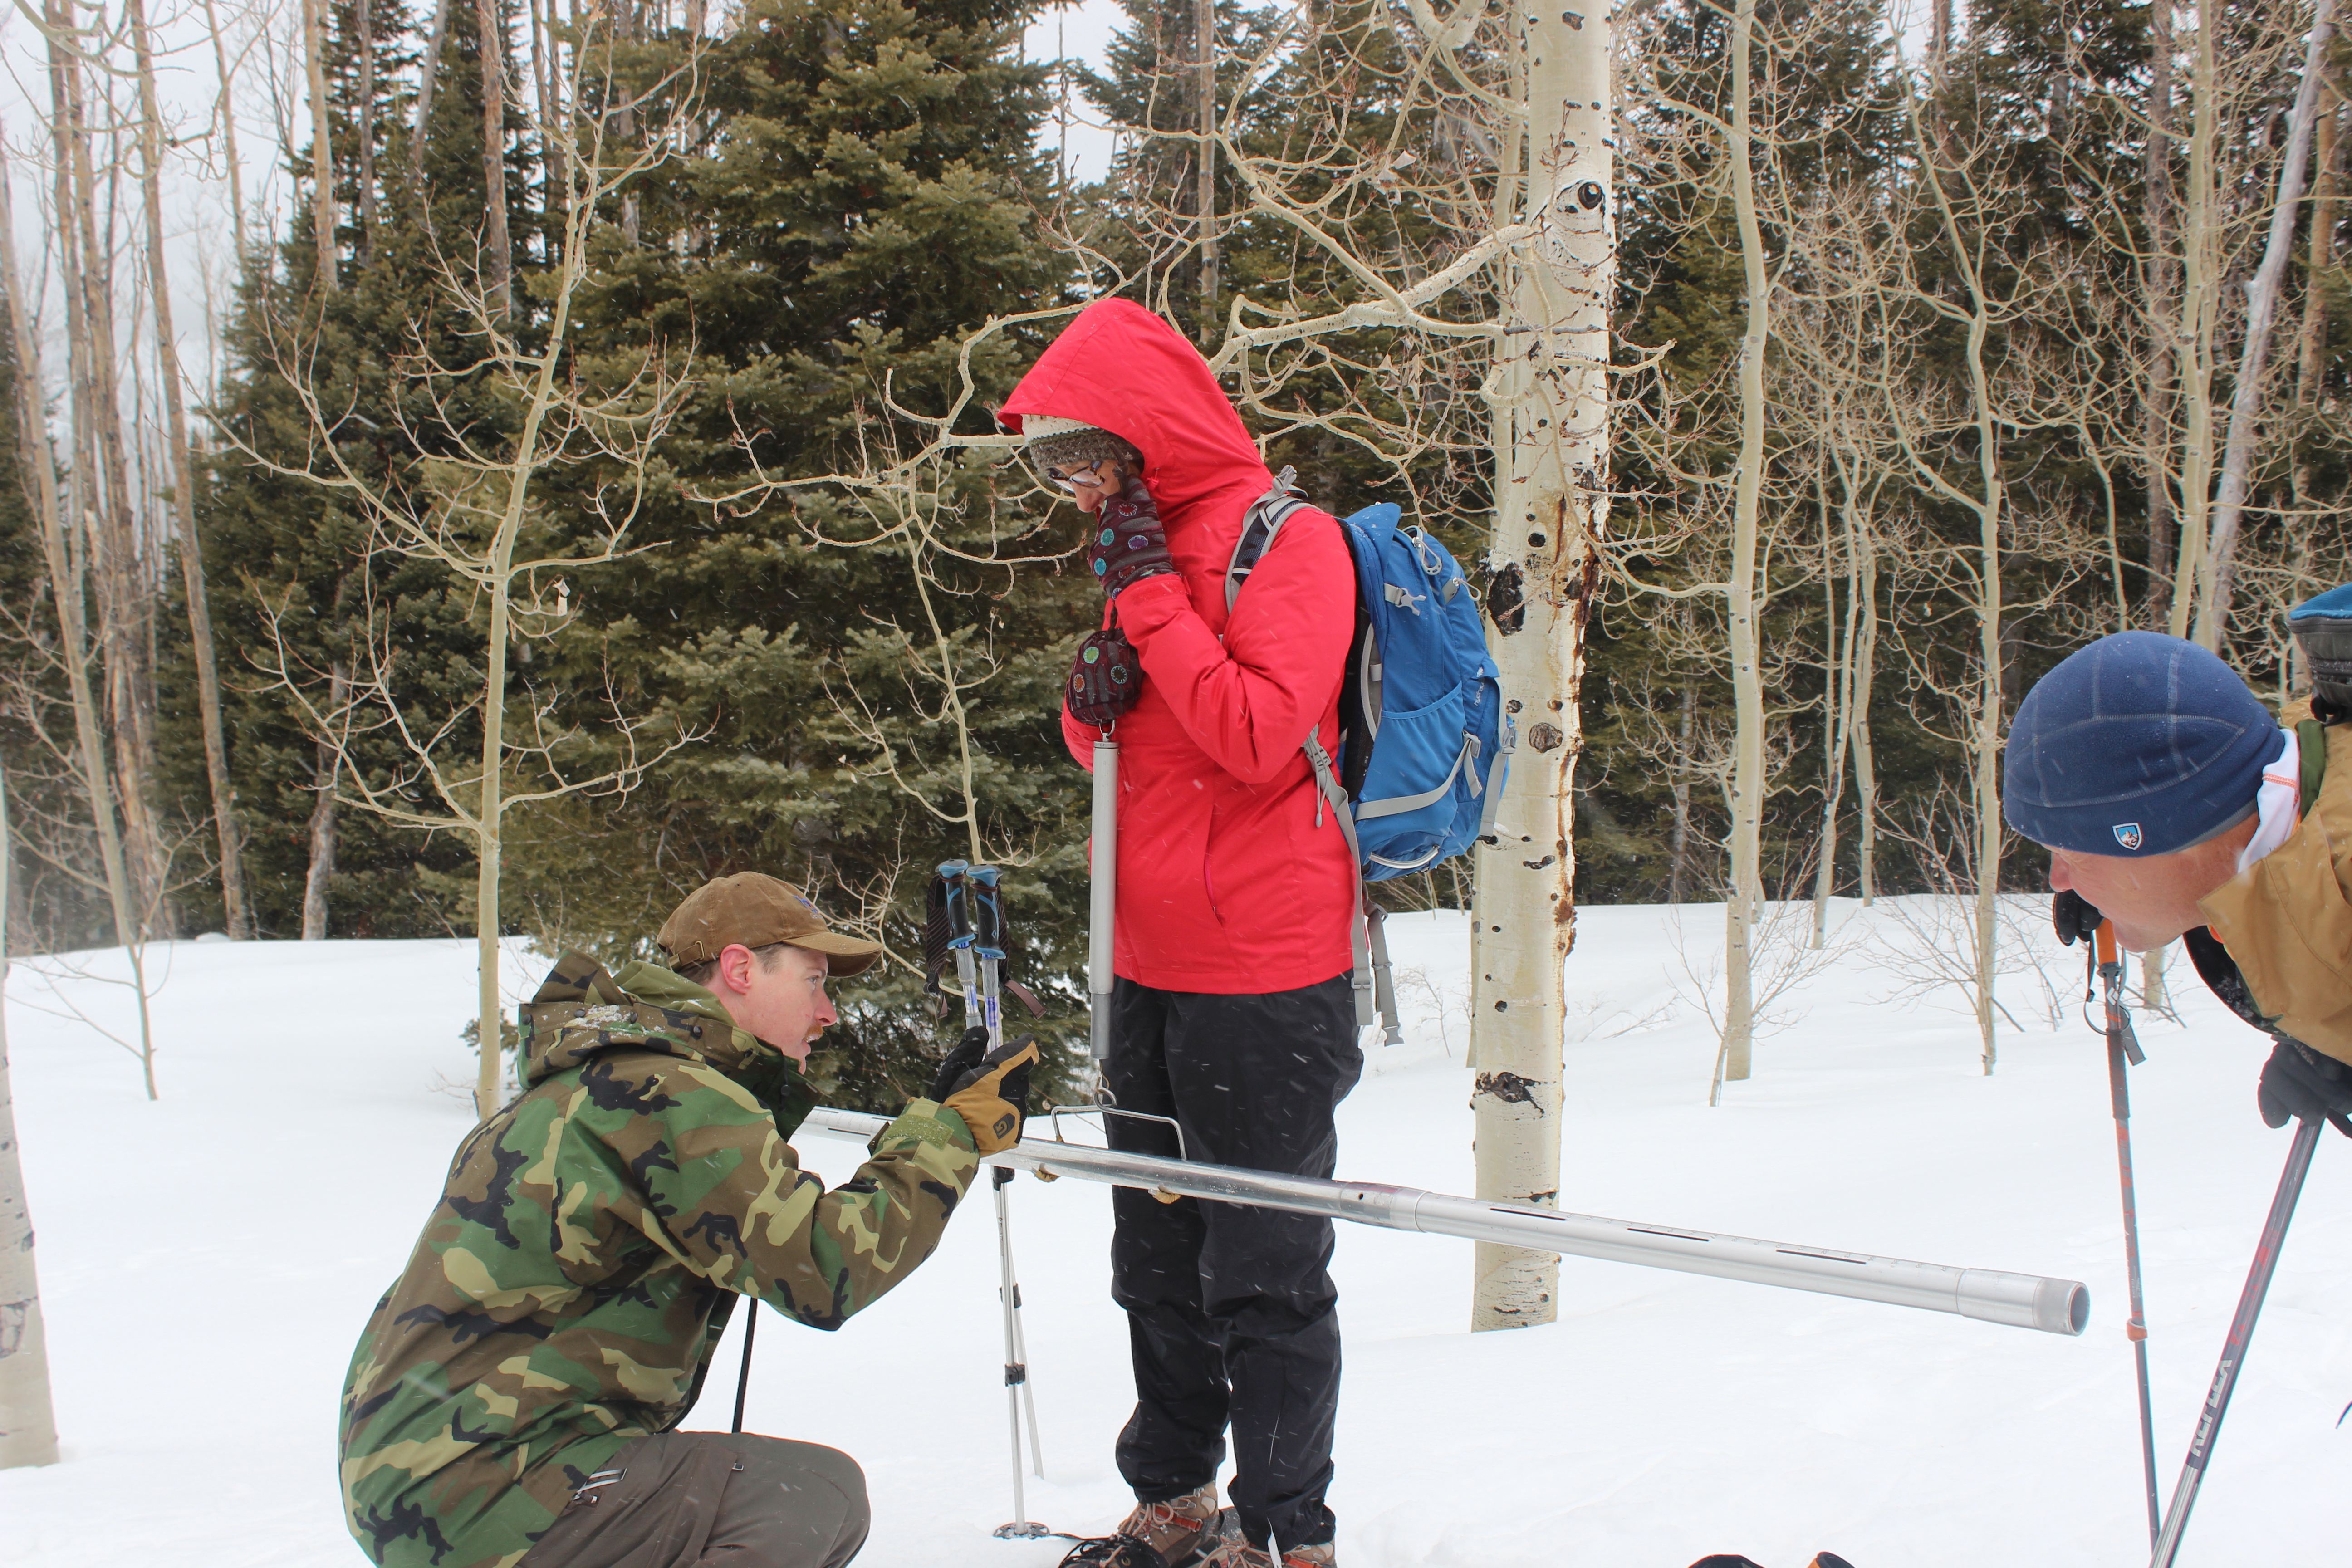
Snow Water Equivalent (SWE) is the amount of liquid water contained in our snowpack if you melted it all down. Hydrologists use this measurement to determine all kinds of things including what to expect for our runoff in the coming spring. SWE is measured at predetermined SNOTEL sites and “snow courses” located high in the mountains where data is transmitted through telemetry to weather stations around the state. For an in depth education about SNOTEL sites check out our “Sno…what’s iTEL about” blog from March of 2022! For now, let’s take a look at our current snowpack and how to read between the flakes.
The NRCS hosts snowpack information through their Colorado Snow Survey Products website, which can be found HERE. The NRCS has made major improvements in their website since our blog post of March 2022. On the website you will find interactive maps to the current SWE for watersheds basins around the state. You can click around on the map to see how neighboring watersheds are stacking up. Below the interactive map you will find the traditional SWE graph for individual basins as well as projections for the year.
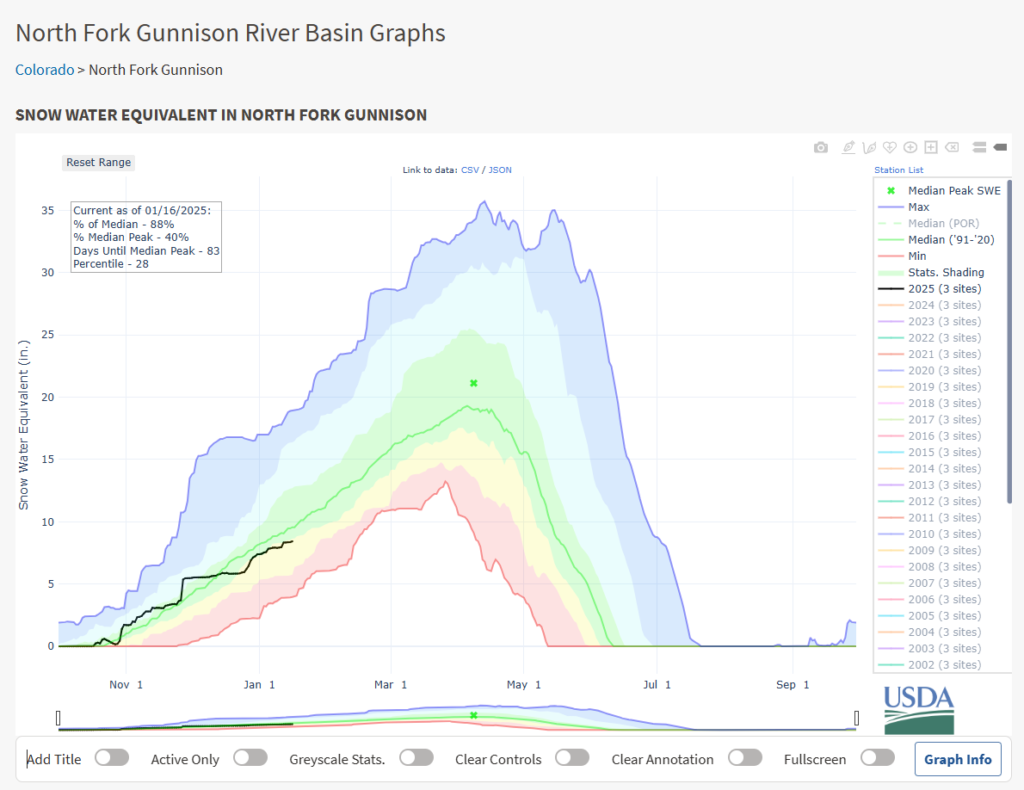
At the time of this posting (Jan 16, 2025), our local watershed the North Fork of the Gunnison (North Fork) Basin was at 88% of median with 83 days left till median peak. The graph can be found below:

To understand the graph, it’s important to note a few things. First, you’ll notice the graph starts in October and ends in September. That’s called “the water year”, and is used by hydrologists and water managers to get a better picture of the water outlook for the year. Secondly, it’s important to know that “median” is different from “average”. Median here represents the middle value of all the highs and lows if they were arranged in ascending or descending order. This is a better representation of the middle for data sets that are not uniformly distributed. And we all know that snowpack is not that!
So the green line represents the middle number on any given day throughout the water year. The third thing to keep in mind is that “median” is based on 30 year normals. That means that the median green line seen on our graph is based on data gathered between 1991 and 2020. NRCS does this to keep comparisons accurate for climatic periods. You can read more about climatic normals HERE. The main thing to keep in mind is that the median line does change ever so slightly from period to period and that normal now is not normal then. A really cool feature of the graph is that you can compare snowpack by year by clicking on the sidebar to the right. Turn them all on to get a sense of the craziness when it comes to distribution!
One last thing to consider when reading a SNOTEL SWE chart is the number and placement of stations that are informing the data. Most SNOTEL site locations range in elevation between 8000 ft – 11,500 ft. throughout Colorado. Though this is considered high elevation, there are many locations in any given watershed that are much higher and therefore receive heavier and more frequent snow events. This is often not captured in SNOTEL data. Let’s take the North Fork again for example: McClure Pass SNOTEL site is located at 8,760 ft and Overland Reservoir SNOTEL sits slightly higher at 9,840 ft. However, Mt. Owen (the highest peak in the watershed) elevation is 13,058 ft and much of the Raggeds and Ruby range peaks are well over 12,000 ft. These ranges are still in the North Fork watershed and SNOTEL sites in the North Fork do not account for snowpack at these levels. Similarly, it’s important to understand that low elevation snowpack at SNOTEL sites such as those in the North Fork, will melt out much sooner than higher elevation snowpack.
NRCS understands this data limitation and in the case of the North Fork, has included an additional SNOTEL site outside the watershed boundary to help improve the accuracy of the data. The additional station is located at Schofield Pass at an elevation of 10,640 ft. Schofield Pass is used as a reasonable representation of the Ragged Wilderness and the Anthracite Creek watersheds which contribute substantial flows to the North Fork. While this certainly improves the accuracy of SWE, just keep in mind that the values that are represented at Schofield will not actually flow into the North Fork Basin. This is a case where we need more data!
There are a lot more snow shoe rabbit holes we could dive into here, but hopefully this gives you some tools to consider when watching the snowpack grow this season. WSCC is planning to keep tabs on the winter snowpack and update our newsletter and blog with changes as we go along this winter. We’ve got 83 days to reach the median peak…keep those snow dances coming!
