
There is a lot of talk these days about Colorado’s snowpack. Are we ahead of average? below average? I hear the basin is 95% of average. How many days till median peak? What’s the Snow Water Equivalent? All of these terms can be confusing to anyone out there who is trying to get a handle on their water outlook and water availability for the coming year. In this segment, we will take a look at some of the basics of the USDA Natural Resources Conservation Service (NRCS) SNOTEL system and how to make sense of all the slush.
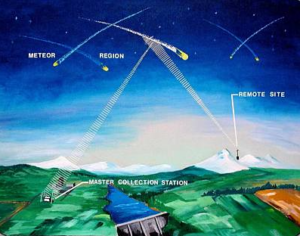
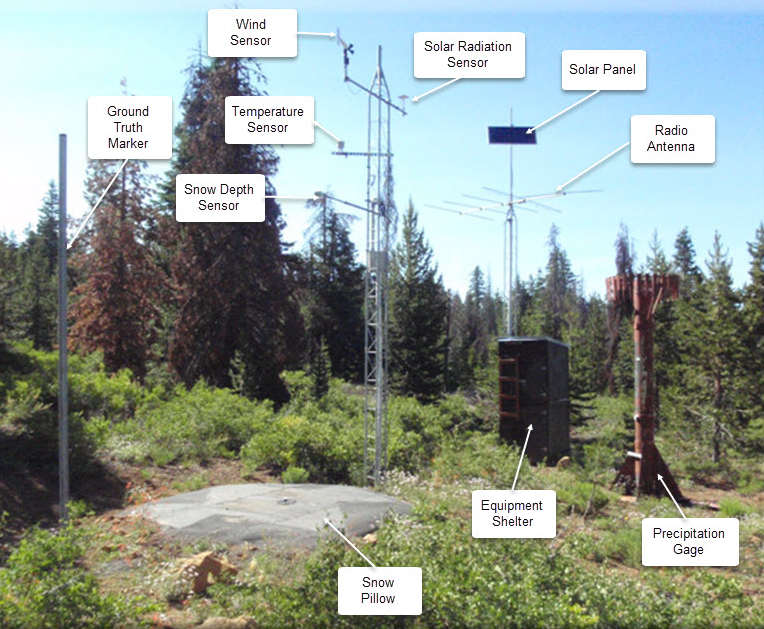
The NRCS has operated an extensive system of highly sensitive snow data stations throughout the intermountain western United States since 1977. These remote stations are located in high mountain areas and contain instruments that gather information about weather and precipitation at the site location and transmit it to weather stations around the west. (Interesting side note: SNOTEL stands for SNOw TELemetry and information gathered from stations is sent to other central locations through meteor burst technology which transmits a signal by “bouncing off” of a band of ionized meteorites existing 50- 80 miles above the earth. )
Each site collects a wide variety weather data including: air temperature, precipitation, depth of snow, and Snow Water Equivalent (SWE). For this discussion we’ll dig a little more into SWE. Snow Water Equivalent (SWE) is a common snowpack measurement used by hydrologists and water managers to gauge the amount of liquid water contained within the snowpack. It is equal to the amount of water contained within the snowpack when it melts. This information is obtained from SNOTEL stations as well as at designated “Snow Courses” near the stations. In effect, the snowpack is “weighed” by instruments to determine the density and amount of water that exists within the snowpack. Individual SNOTEL stations relay this information to other stations in the watershed to determine how many inches of water are being stored within the watershed’s snowpack. The accumulated SWE average of all the SNOTEL sites in a watershed determines the SWE for the basin. This information can be found on the NRCS SNOTEL website HERE.
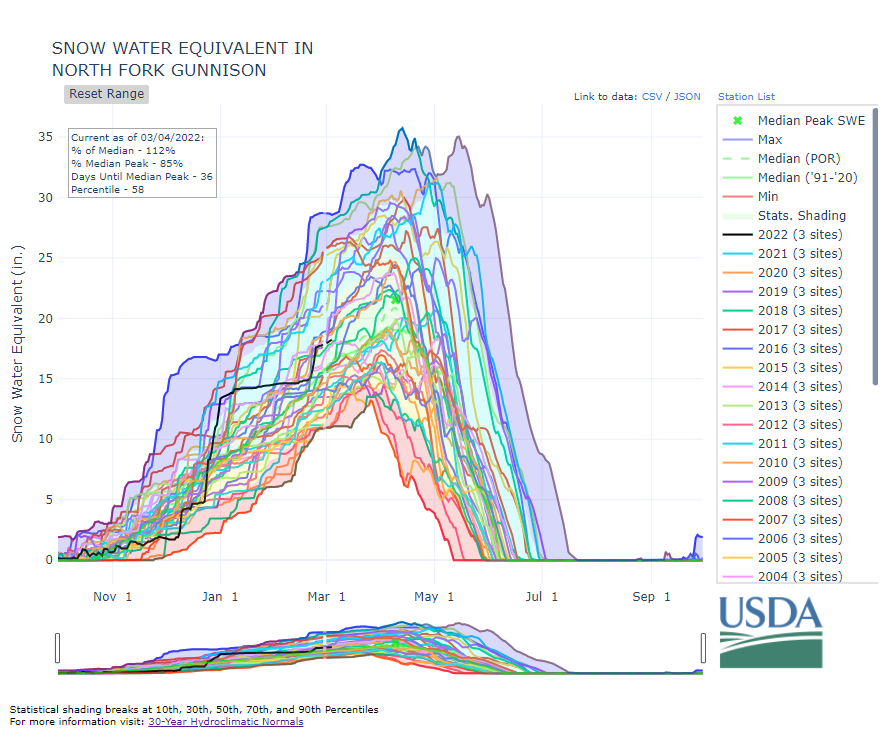
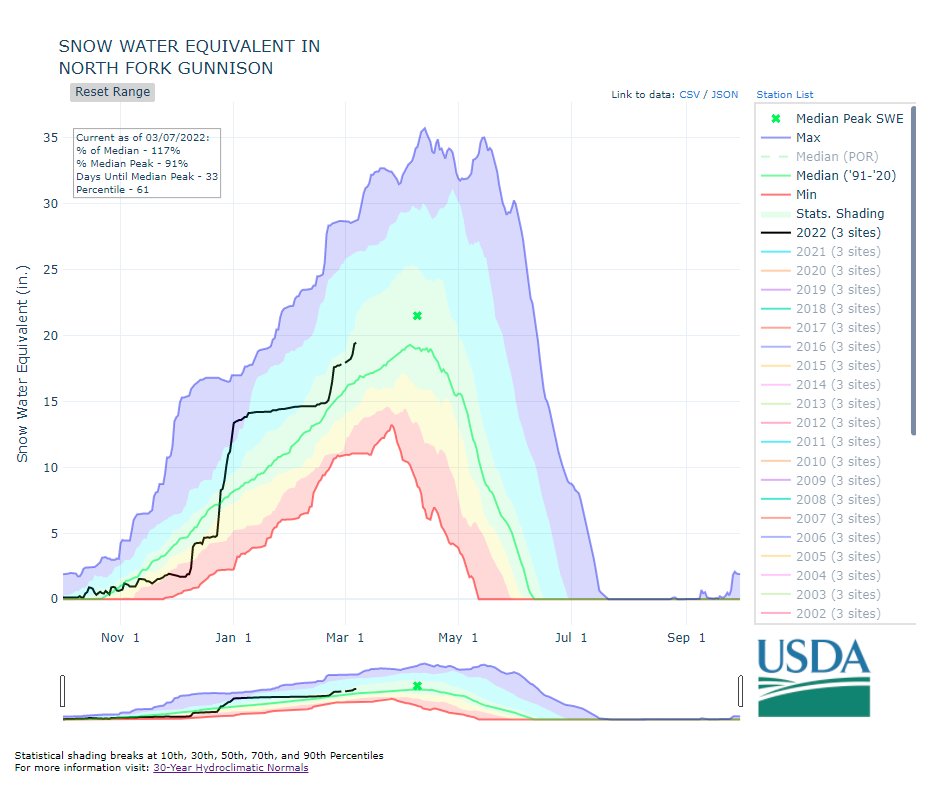 Snow Water Equivalent (SWE), North Fork Gunnison River Basin, 3/7/22
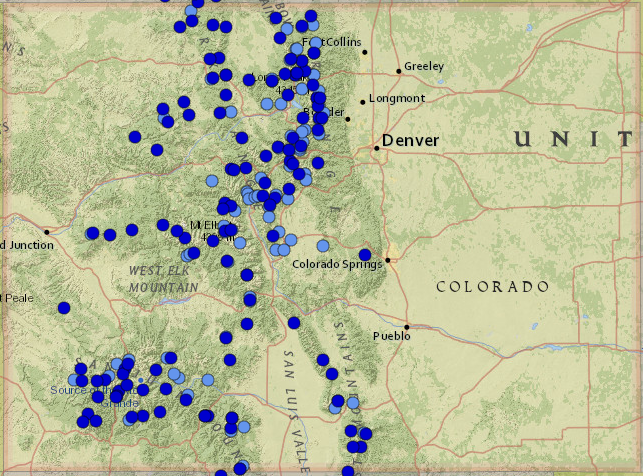
There are few things to keep in mind when looking at a SWE graph. The first is that there are approx. 115 SNOTEL sites that exist in Colorado. Not every watershed has the same amount of SNOTEL sites. As you can seen from the map to the right, SNOTEL locations in Colorado vary greatly through out the state. The NRCS website supports an interactive map to help you locate stations closest to you. It is important to know that while some watersheds in Colorado contain many SNOTEL information stations, some watersheds such as the North Fork of the Gunnison (North Fork) contain only a couple. This can often skew a viewers outlook of what is actually going on terms of snowpack. In the case of the North Fork graph listed above, it’s important to understand that the data being shown in the graph is really for 2 stations, one located at McClure pass and the other at Overland Reservoir. This doesn’t provide a full picture of snowpack for the North Fork, because it does not take into account information from the eastern most portion of the watershed. In this case, the Anthracite river basin, which contributes a significant amount of run off in the spring.
The second thing to keep in mind is that most SNOTEL site locations range in elevation between 8000 ft – 11,500 ft. throughout Colorado. Though this is considered high elevation, there are many locations in any given watershed that are much higher and therefore receive heavier and more frequent snow events. This is often times not captured in SNOTEL data. Let’s take the North Fork again for example: McClure Pass SNOTEL site is located at 8,760 ft and Overland Reservoir SNOTEL sits slightly higher at 9,840 ft. However, Mt. Owen (the highest peak in the watershed) elevation is 13,058 ft and much of the Raggeds and Ruby range peaks are well over 12,000 ft. These ranges are still in the North Fork watershed and SNOTEL sites in the North Fork do not account for snowpack at these levels. Similarly, it’s important to understand that low elevations snowpack at SNOTEL sites such as those in the North Fork, will melt out much sooner than higher elevation snowpack. We’ll expand on that a little more below.
Finally, when looking at a SNOTEL graph it’s important to note that the data represented is based on 30-year hydroclimatic norms. That’s a fancy way of saying that the range expressed in the graph is limited to a 30-year comparison. The norms do get updated every decade within the 30 year window. This becomes extremely relevant information when thinking about climate change in the west. Climatologist have shown that average precipitation has not changed much in the last 100 years. However, average temperatures in Colorado have continued to climb to the tune of about 2.5 degrees over the last 100 years. The graphs below are taken from the 2022 NOAA state climate summary for Colorado.
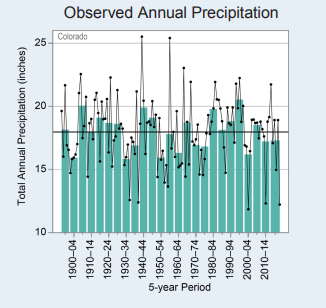
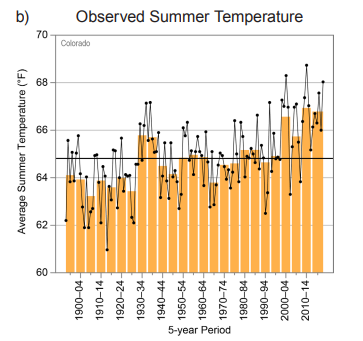
When reading a SNOTEL graph remember that words like “median” and “normal” are based on these 30- year comparisons. Big snow years like those seen in the 1980’s in Colorado are not included in this more recent data set. Climate change may have an unknown long term effect on precipitation, but it is important to be aware that prolonged drought years will skew what is considered “normal”. Furthermore, increasing temperatures in Colorado have meant that the snowpack tends to run off earlier in the year. This is especially the case for many of the low elevation SNOTEL sites. In summary, keep in mind that what is considered “normal” now was not “normal” then.
With this background, let’s look again at the North Fork SNOTEL graph. (Click this link and select North Fork Gunnison from the sub basin menu to interact with a live version of the chart and follow along. ) At the time of this post the North Fork basin was reporting 117% of median (March 7, 2022). With 33 days to reach the median peak, things were looking pretty good, right? Yes! Any day the SNOTEL chart is reading above average gets a Hoorah from us! Let’s spend a little time navigating the interactive map.
Firstly, the side bar to the right of the graph allows you to select other years to compare. This is one way to compare the current SWE with years that fall outside that 30-year median line. Next, direct your attention to the most upper line on the chart. This is the maximum SWE measured on any given day over the years listed in the sidebar. Similarly, the lower line on the chart is the minimum for any given day. Here’s what happens when you select them all:
That’s very colorful. More importantly, it exemplifies the wide spectrum of precipitation we can receive from year to year. Remember our earlier discussion about how climate change has had little impact on amount of precipitation over the last 100 years, but rather has shown a steady increase in temperatures over that time period. I am reminded of a friend of mine, whose father was a local water commissioner and said. “It’s not how it comes down, but how it comes off.” I think about that statement when I’m watching our low elevation snow melt away on a 60 degree day in February. Take a good look at the the end of the run-off curves in that chart. There has only been ONE instance in the past 10 years where the hydrograph carried any water past June 17th. That year was 2019 and the graph doesn’t bottom out until July 4th. I’m reminded again of an old timer who gestured to a spot on the side of Mt. Lamborn and said, “If there is still snow left in the book on July 4th, its gonna be an OK water year”. 2019 wasn’t an especially amazing water year, but it was one that had us feeling hopeful about Colorado’s ongoing drought.
It is important that we continue to improve our understanding of our watershed’s hydrology. Fortunately there are scientists out there experimenting with new technology. Tools such as Lidar and other remote sensing instruments offer new ways to study our snowpack. For now the SNOTEL offers one of the best ways to tell the story of the snowpack. Looks like we’ve got 33 days to reach our median snowpack peak…. Keep those snow dances coming!
Great explanation of Snotel. Will share on my fb page🤩